| Monthly State Retail Sales: Motor Vehicle and Parts Dealers in Minnesota |
| 2024-04-30 11:02:04-05 / Monthly / Percent Change from Year Ago |  |
| The Monthly State Retail Sales (MSRS) report is a blended data product combining Monthly Retail Trade Survey data, administrative data, and third-party data. Data are available for year-over-year percent changes for Total Retail Sales excluding Nonstore Retailers as well as 11 North American Industry Classification System (NAICS) retail subsectors. For more information on the MSRS view the methodology (https://www.census.gov/data/experimental-data-products/monthly-state-retail-sales.html). This is the first version of these experimental data. This series measures retail sales for automotive dealers; other motor vehicle dealers; automotive parts, accessories, and tire stores. The listed retailers correspond to 4411, 4412, 4413 in the 2017 NAICS manual. |
| Monthly State Retail Sales: Furniture and Home Furnishings Stores in Minnesota |
| 2024-04-30 11:02:04-05 / Monthly / Percent Change from Year Ago |  |
| The Monthly State Retail Sales (MSRS) report is a blended data product combining Monthly Retail Trade Survey data, administrative data, and third-party data. Data are available for year-over-year percent changes for Total Retail Sales excluding Nonstore Retailers as well as 11 North American Industry Classification System (NAICS) retail subsectors. For more information on the MSRS view the methodology (https://www.census.gov/data/experimental-data-products/monthly-state-retail-sales.html). This is the first version of these experimental data. This series measures retail sales for furniture stores; home furnishing stores. The listed retailers correspond to 4421, 4422 in the 2017 NAICS manual. |
| Monthly State Retail Sales: Electronics and Appliance Stores in Minnesota |
| 2024-04-30 11:02:04-05 / Monthly / Percent Change from Year Ago | 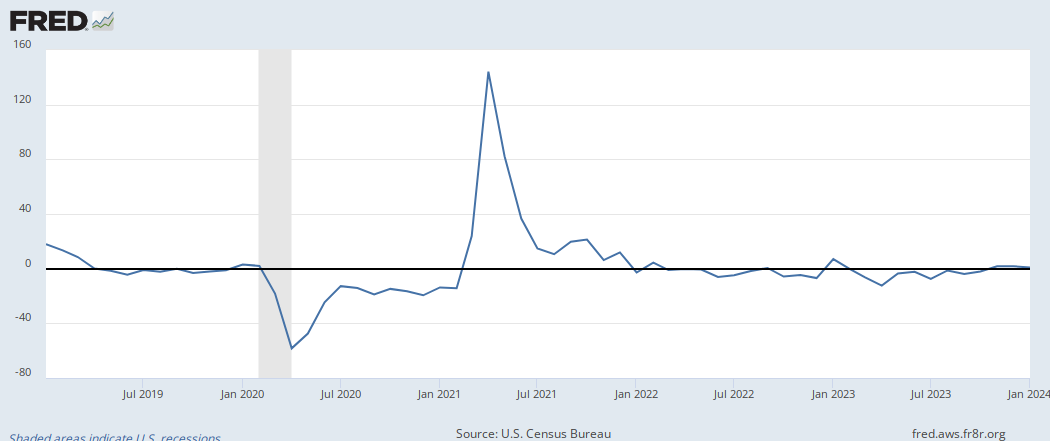 |
| The Monthly State Retail Sales (MSRS) report is a blended data product combining Monthly Retail Trade Survey data, administrative data, and third-party data. Data are available for year-over-year percent changes for Total Retail Sales excluding Nonstore Retailers as well as 11 North American Industry Classification System (NAICS) retail subsectors. For more information on the MSRS view the methodology (https://www.census.gov/data/experimental-data-products/monthly-state-retail-sales.html). This is the first version of these experimental data. This series measures retail sales for electronics and appliances stores. The listed retailers correspond to 4431 in the 2017 NAICS manual. |
| Monthly State Retail Sales: Building Material and Garden Equipment and Supplies Dealers in Minnesota |
| 2024-04-30 11:02:04-05 / Monthly / Percent Change from Year Ago |  |
| The Monthly State Retail Sales (MSRS) report is a blended data product combining Monthly Retail Trade Survey data, administrative data, and third-party data. Data are available for year-over-year percent changes for Total Retail Sales excluding Nonstore Retailers as well as 11 North American Industry Classification System (NAICS) retail subsectors. For more information on the MSRS view the methodology (https://www.census.gov/data/experimental-data-products/monthly-state-retail-sales.html). This is the first version of these experimental data. This series measures retail sales for home centers; paint and wallpaper stores; hardware stores; other building material dealers; outdoor power equipment stores; nursery, garden center, and farm supply stores. The listed retailers correspond to 44411, 44412, 44413, 44419, 44421, 44422 in the 2017 NAICS manual. |
| Monthly State Retail Sales: Health and Personal Care Stores in Minnesota |
| 2024-04-30 11:02:04-05 / Monthly / Percent Change from Year Ago |  |
| The Monthly State Retail Sales (MSRS) report is a blended data product combining Monthly Retail Trade Survey data, administrative data, and third-party data. Data are available for year-over-year percent changes for Total Retail Sales excluding Nonstore Retailers as well as 11 North American Industry Classification System (NAICS) retail subsectors. For more information on the MSRS view the methodology (https://www.census.gov/data/experimental-data-products/monthly-state-retail-sales.html). This is the first version of these experimental data. This series measures retail sales for pharmacies and drug stores; cosmetics, beauty supplies, and perfume stores; optical goods stores; other health and personal care stores. The listed retailers correspond to 44611, 44612, 44613, 44619 in the 2017 NAICS manual. |
| Monthly State Retail Sales: Gasoline Stations in Minnesota |
| 2024-04-30 11:02:04-05 / Monthly / Percent Change from Year Ago |  |
| The Monthly State Retail Sales (MSRS) report is a blended data product combining Monthly Retail Trade Survey data, administrative data, and third-party data. Data are available for year-over-year percent changes for Total Retail Sales excluding Nonstore Retailers as well as 11 North American Industry Classification System (NAICS) retail subsectors. For more information on the MSRS view the methodology (https://www.census.gov/data/experimental-data-products/monthly-state-retail-sales.html). This is the first version of these experimental data. This series measures retail sales for gasoline stations. The listed retailers correspond to 4471 in the 2017 NAICS manual. |
| Monthly State Retail Sales: Sporting Good, Hobby, Musical Instrument and Book Stores in Minnesota |
| 2024-04-30 11:02:04-05 / Monthly / Percent Change from Year Ago | 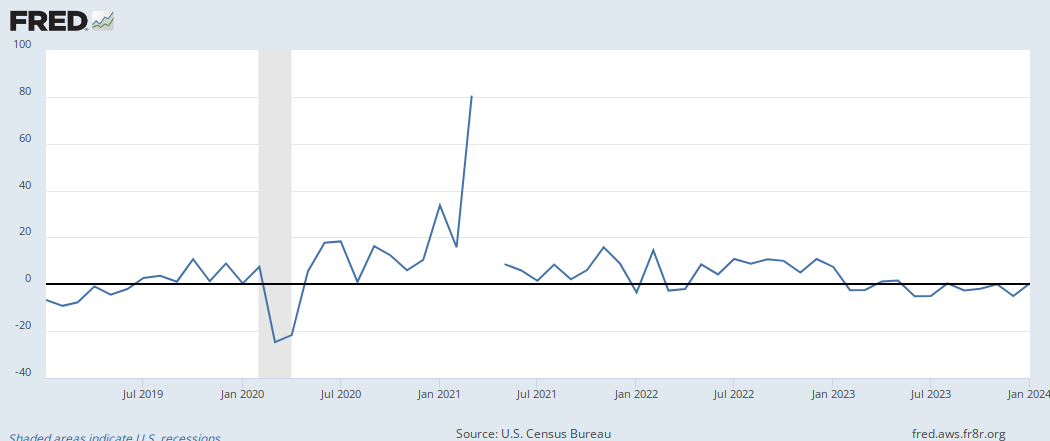 |
| The Monthly State Retail Sales (MSRS) report is a blended data product combining Monthly Retail Trade Survey data, administrative data, and third-party data. Data are available for year-over-year percent changes for Total Retail Sales excluding Nonstore Retailers as well as 11 North American Industry Classification System (NAICS) retail subsectors. For more information on the MSRS view the methodology (https://www.census.gov/data/experimental-data-products/monthly-state-retail-sales.html). This is the first version of these experimental data. This series measures retail sales for sporting goods stores; hobby, toy, and game stores; sewing, needlework and piece goods stores; musical instrument and supply stores; book stores; news dealers and newsstands. The listed retailers correspond to 45111, 45112, 45113, 45114, 45121, 45122 in the 2017 NAICS manual. |
| Monthly State Retail Sales: General Merchandise Stores in Minnesota |
| 2024-04-30 11:02:04-05 / Monthly / Percent Change from Year Ago |  |
| The Monthly State Retail Sales (MSRS) report is a blended data product combining Monthly Retail Trade Survey data, administrative data, and third-party data. Data are available for year-over-year percent changes for Total Retail Sales excluding Nonstore Retailers as well as 11 North American Industry Classification System (NAICS) retail subsectors. For more information on the MSRS view the methodology (https://www.census.gov/data/experimental-data-products/monthly-state-retail-sales.html). This is the first version of these experimental data. This series measures retail sales for department stores (except discount department stores); discount department stores; other general merchandise stores (including warehouse clubs and supercenters). The listed retailers correspond to 452111, 452112, 4529 in the 2017 NAICS manual. |
| Monthly State Retail Sales: Miscellaneous Store Retailers in Minnesota |
| 2024-04-30 11:02:04-05 / Monthly / Percent Change from Year Ago |  |
| The Monthly State Retail Sales (MSRS) report is a blended data product combining Monthly Retail Trade Survey data, administrative data, and third-party data. Data are available for year-over-year percent changes for Total Retail Sales excluding Nonstore Retailers as well as 11 North American Industry Classification System (NAICS) retail subsectors. For more information on the MSRS view the methodology (https://www.census.gov/data/experimental-data-products/monthly-state-retail-sales.html). This is the first version of these experimental data. This series measures retail sales for florists; office supply and stationary stores; gift, novelty, and souvenier stores; used merchandise stores; pet and pet supplies stores; art dealers; manufactured (mobile) home dealers; other miscellaneous store retailers. The listed retailers correspond to 4531, 45321, 45322, 4533, 45391, 45392, 45393, 45399 in the 2017 NAICS manual. |
| Monthly State Retail Sales: Total Retail Sales Excluding Nonstore Retailers in Minnesota |
| 2024-04-30 11:02:04-05 / Monthly / Percent Change from Year Ago |  |
| The Monthly State Retail Sales (MSRS) report is a blended data product combining Monthly Retail Trade Survey data, administrative data, and third-party data. Data are available for year-over-year percent changes for Total Retail Sales excluding Nonstore Retailers as well as 11 North American Industry Classification System (NAICS) retail subsectors. For more information on the MSRS view the methodology (https://www.census.gov/data/experimental-data-products/monthly-state-retail-sales.html). This is the first version of these experimental data. This series measures retail sales for all retailers except nonstore retailers. The listed retailers correspond to 44-45 in the 2017 NAICS manual. |
| All-Transactions House Price Index for Minnesota |
| 2023-10-01 / Quarterly / Index 1980:Q1=100 |  |
| Estimated using sales prices and appraisal data. |
| State Minimum Wage Rate for Minnesota |
| 2024-01-01 / Annual / Dollars per Hour |  |
| State minimum wage applies only after a certain level of gross annual sales or receipts is reached by the employer. For more information, visit https://www.dol.gov/whd/state/stateMinWageHis.htm |
| S&P CoreLogic Case-Shiller MN-Minneapolis Home Price Index |
| 2024-02-01 / Monthly / Index Jan 2000=100 |  |
| For more information regarding the index, please visit Standard & Poor's (https://www.spglobal.com/spdji/en/documents/methodologies/methodology-sp-corelogic-cs-home-price-indices.pdf). Copyright © 2016, S&P Dow Jones Indices LLC. All rights reserved. Reproduction of Home Price Index for Minneapolis, Minnesota in any form is prohibited except with the prior written permission of S&P Dow Jones Indices LLC "S&P". S&P does not guarantee the accuracy, adequacy, completeness or availability of any information and is not responsible for any errors or omissions, regardless of the cause or for the results obtained from the use of such information. S&P DISCLAIMS ANY AND ALL EXPRESS OR IMPLIED WARRANTIES, INCLUDING, BUT NOT LIMITED TO, ANY WARRANTIES OF MERCHANTABILITY OR FITNESS FOR A PARTICULAR PURPOSE OR USE. In no event shall S&P be liable for any direct, indirect, special or consequential damages, costs, expenses, legal fees, or losses (including lost income or lost profit and opportunity costs) in connection with subscriber's or others' user of Home Price Index for Minneapolis, Minnesota. Permission to reproduce this series can be requested from [email protected]. More contact details are available from http://us.spindices.com/contact-us/, including phone numbers for all of its regional offices. |
| All-Transactions House Price Index for Minneapolis-St. Paul-Bloomington, MN-WI (MSA) |
| 2023-10-01 / Quarterly / Index 1995:Q1=100 |  |
| Estimated using sales prices and appraisal data. |
| Real Median Household Income in Minnesota |
| 2022-01-01 / Annual / 2022 CPI-U-RS Adjusted Dollars |  |
| Household data are collected as of March. Consumer Price Index research series using current methods (CPI-U-RS) presents an estimate of the CPI for all Urban Consumers (CPI-U) that incorporates most of the improvements made over that time span into the entire series. More information can be found at https://www.bls.gov/cpi/research-series/home.htm. As stated in the Census's "Source and Accuracy of Estimates for Income, Poverty, and Health Insurance Coverage in the United States: 2011" (http://www.census.gov/hhes/www/p60_243sa.pdf): Estimation of Median Incomes. The Census Bureau has changed the methodology for computing median income over time. The Census Bureau has computed medians using either Pareto interpolation or linear interpolation. Currently, we are using linear interpolation to estimate all medians. Pareto interpolation assumes a decreasing density of population within an income interval, whereas linear interpolation assumes a constant density of population within an income interval. The Census Bureau calculated estimates of median income and associated standard errors for 1979 through 1987 using Pareto interpolation if the estimate was larger than $20,000 for people or $40,000 for families and households. This is because the width of the income interval containing the estimate is greater than $2,500. We calculated estimates of median income and associated standard errors for 1976, 1977, and 1978 using Pareto interpolation if the estimate was larger than $12,000 for people or $18,000 for families and households. This is because the width of the income interval containing the estimate is greater than $1,000. All other estimates of median income and associated standard errors for 1976 through 2011 (2012 ASEC) and almost all of the estimates of median income and associated standard errors for 1975 and earlier were calculated using linear interpolation. Thus, use caution when comparing median incomes above $12,000 for people or $18,000 for families and households for different years. Median incomes below those levels are more comparable from year to year since they have always been calculated using linear interpolation. For an indication of the comparability of medians calculated using Pareto interpolation with medians calculated using linear interpolation, see Series P-60, Number 114, Money Income in 1976 of Families and Persons in the United States (www2.census.gov/prod2/popscan/p60-114.pdf). |
| Unemployment Rate in Minnesota |
| 2024-03-01 / Monthly / Percent |  |
| Housing Inventory: Active Listing Count in Minneapolis-ST. Paul-Bloomington, MN-WI (CBSA) |
| 2024-03-01 / Monthly / Level |  |
| The count of active single-family and condo/townhome listings for a given market during the specified month (excludes pending listings). With the release of its September 2022 housing trends report, Realtor.com® incorporated a new and improved methodology for capturing and reporting housing inventory trends and metrics. The new methodology updates and improves the calculation of time on market and improves handling of duplicate listings. Most areas across the country will see minor changes with a smaller handful of areas seeing larger updates. As a result of these changes, the data released since October 2022 will not be directly comparable with previous data releases (files downloaded before October 2022) and Realtor.com® economics blog posts. However, future data releases, including historical data, will consistently apply the new methodology. More details are available at the source's Real Estate Data Library (https://www.realtor.com/research/data/). With the release of its November 2021 housing trends report, Realtor.com® incorporated a new and improved methodology for capturing and reporting housing inventory trends and metrics. The new methodology uses the latest and most accurate data mapping of listing statuses to yield a cleaner and more consistent measurement of active listings at both the national and local level. The methodology has also been adjusted to better account for missing data in some fields including square footage. Most areas across the country will see minor changes with a smaller handful of areas seeing larger updates. As a result of these changes, the data released since December 2021 will not be directly comparable with previous data releases (files downloaded before December 2021) and Realtor.com® economics blog posts. However, future data releases, including historical data, will consistently apply the new methodology. More details are available at the source's Real Estate Data Library (https://www.realtor.com/research/data/). |
| Total Gross Domestic Product for Minneapolis-St. Paul-Bloomington, MN-WI (MSA) |
| 2022-01-01 / Annual / Millions of Dollars |  |
| The All industry total includes all Private industries and Government. Gross domestic product (GDP) by metropolitan area is the measure of the market value of all final goods and services produced within a metropolitan area in a particular period of time. In concept, an industry's GDP by metropolitan area, referred to as its "value added", is equivalent to its gross output (sales or receipts and other operating income, commodity taxes, and inventory change) minus its intermediate inputs (consumption of goods and services purchased from other U.S. industries or imported). GDP by metropolitan area is the metropolitan area counterpart of the nation's, BEA's featured measure of U.S. production. For more information about this release go to http://www.bea.gov/newsreleases/regional/gdp_metro/gdp_metro_newsrelease.htm. |
| Resident Population in Minneapolis-St. Paul-Bloomington, MN-WI (MSA) |
| 2023-01-01 / Annual / Thousands of Persons |  |
| All observations are July 1 estimates of each year. |
| Unemployment Rate in Minneapolis-St. Paul-Bloomington, MN-WI (MSA) |
| 2024-02-01 / Monthly / Percent |  |
| All-Transactions House Price Index for Minnesota |
| 2023-10-01 / Quarterly / Index 1980:Q1=100 | |
| State Minimum Wage Rate for Minnesota |
| 2024-01-01 / Annual / Dollars per Hour | |
| Unemployment Rate in Minnesota |
| 2024-03-01 / Monthly / Percent | |
| Real Median Household Income in Minnesota |
| 2022-01-01 / Annual / 2022 CPI-U-RS Adjusted Dollars | |
| Gross Domestic Product: All Industry Total in Minnesota |
| 2023-01-01 / Annual / Millions of Dollars |  |
| Housing Inventory: Active Listing Count in Minnesota |
| 2024-03-01 / Monthly / Level |  |
| Rental Vacancy Rate for Minnesota |
| 2023-01-01 / Annual / Percent |  |
| Labor Force Participation Rate for Minnesota |
| 2024-03-01 / Monthly / Percent |  |
| Per Capita Personal Income in Minnesota |
| 2023-01-01 / Annual / Dollars |  |
| New Private Housing Units Authorized by Building Permits: 1-Unit Structures for Minnesota |
| 2024-03-01 / Monthly / Units |  |
| Median Household Income in Minnesota |
| 2022-01-01 / Annual / Current Dollars |  |
| Resident Population in Minnesota |
| 2023-01-01 / Annual / Thousands of Persons |  |
| Continued Claims (Insured Unemployment) in Minnesota |
| 2024-04-13 / Weekly / Number |  |
| Homeownership Rate for Minnesota |
| 2023-01-01 / Annual / Percent |  |
| Housing Inventory: Median Listing Price per Square Feet in Minnesota |
| 2024-03-01 / Monthly / U.S. Dollars |  |
| Real Gross Domestic Product: All Industry Total in Minnesota |
| 2023-10-01 / Quarterly / Millions of Chained 2017 Dollars |  |
| Pandemic Unemployment Assistance Initial Claims in Minnesota |
| 2022-11-05 / Weekly / Number |  |
| Initial Claims in Minnesota |
| 2024-04-20 / Weekly / Number |  |
| SNAP Benefits Recipients in Minnesota |
| 2022-06-01 / Monthly / Persons |  |
| All Employees: Total Nonfarm in Minnesota |
| 2024-03-01 / Monthly / Thousands of Persons |  |
| Average Hourly Earnings of All Employees: Total Private in Minnesota (DISCONTINUED) |
| 2022-03-01 / Monthly / Dollars per Hour |  |
| State Tax Collections: Total Taxes for Minnesota |
| 2023-10-01 / Quarterly / Millions of U.S. Dollars |  |
| Zillow Home Value Index (ZHVI) for All Homes Including Single-Family Residences, Condos, and CO-OPs in Minnesota |
| 2024-03-01 / Monthly / Dollars |  |
| New Private Housing Units Authorized by Building Permits for Minnesota |
| 2024-03-01 / Monthly / Units |  |
| Average Hourly Earnings of Production Employees: Manufacturing: Durable Goods in Minnesota |
| 2023-01-01 / Annual / Dollars per Hour |  |
| Average Hourly Earnings of Production Employees: Leisure and Hospitality: Food Services and Drinking Places in Minnesota (DISCONTINUED) |
| 2022-03-01 / Monthly / Dollars per Hour |  |
| Real Gross Domestic Product: Support Activities for Mining (213) in Minnesota |
| 2022-01-01 / Annual / Millions of Chained 2017 Dollars |  |
| Gross Domestic Product: Support Activities for Mining (213) in Minnesota |
| 2022-01-01 / Annual / Millions of Dollars |  |
| Chain-Type Quantity Index for Real GDP: Textile Mills and Textile Product Mills (313-314) in Minnesota |
| 2022-01-01 / Annual / Index 2017=100 |  |
| Chain-Type Quantity Index for Real GDP: Mining (Except Oil and Gas) (212) in Minnesota |
| 2022-01-01 / Annual / Index 2017=100 |  |
| Real Gross Domestic Product: Rail Transportation (482) in Minnesota |
| 2022-01-01 / Annual / Millions of Chained 2017 Dollars |  |
| Per Capita Personal Consumption Expenditures: Services: Health Care for Minnesota |
| 2022-01-01 / Annual / Dollars |  |
| Per Capita Personal Consumption Expenditures: Services: Household Consumption Expenditures for Services for Minnesota |
| 2022-01-01 / Annual / Dollars |  |
| Per Capita Personal Consumption Expenditures: Nondurable Goods: Clothing and Footwear for Minnesota |
| 2022-01-01 / Annual / Dollars |  |

| Real Gross Domestic Product: Textile Mills and Textile Product Mills (313-314) in Minnesota |
| 2022-01-01 / Annual / Millions of Chained 2017 Dollars |  |
| Bachelor's Degree or Higher for Minnesota |
| 2022-01-01 / Annual / Percent |  |
| Gross Domestic Product: Utilities (22) in Minnesota |
| 2023-10-01 / Quarterly / Millions of Dollars |  |
| Home Vacancy Rate for Minnesota |
| 2023-01-01 / Annual / Percent |  |